What Is Instagram Insights? A 2026 Overview
Instagram Insights is the free analytics dashboard built into Instagram professional accounts — Business or Creator. Instagram Insights explained for beginners comes down to three things: it shows how many people see your content, how they interact with it, and who they are. Together, those panels turn every post into a lesson about what to make next.
In 2026 the dashboard reads a little differently than the old tutorials describe. Instagram moved to Views as the headline metric across formats — one number for Reels plays, post displays and Story views — and the old "impressions" figure is being retired. Account-level data also runs on a roughly 90-day rolling window, so Insights is a short-memory instrument: brilliant for this quarter, blind beyond it. Both changes matter for how you read the numbers, and both are covered in detail below.
Why bother learning it at all? Because growth on Instagram is a feedback problem, not a volume problem. Two creators can post the same number of Reels; the one who checks which three travelled furthest — and why — compounds the learning with every upload. Insights is simply where that feedback lives. It costs nothing, it takes five minutes a week, and it is the single most underused growth tool on the platform.
How to Use Instagram Insights 2026: Unlocking the Dashboard
Learning how to use Instagram Insights 2026 starts with one requirement: Insights lives only on professional accounts. If you tap your profile menu and see no "Insights" option, you are on a personal account and you are not missing a setting — the analytics genuinely do not exist there.
Step 1: Go to your profile, tap the menu (three lines, top right), then Settings and privacy → Account type and tools → Switch to professional account.
Step 2: Choose Creator (for individuals, influencers, personal brands) or Business (for shops, services, companies). Both unlock the full analytics suite — and you can switch again later. Pick a category that fits and finish the prompts.
Step 3: When people ask how to check Instagram analytics after the switch, the fastest route is the View professional dashboard button right under your bio — it is the shortcut to your numbers. The alternative is the menu again: scroll to the "For professionals" section and tap Insights. Either way opens the same three-panel dashboard.
Step 4: Understand the two cold-start rules. First, Instagram does not backfill data — analytics start accumulating from the moment you switch, so a brand-new professional account will look empty for a week or two. Second, some audience metrics stay thin until your following grows; Meta notes that certain metrics are unavailable on very small accounts, so if your demographics look sparse under a hundred followers, that is normal. Post consistently for two to four weeks, then start reading.
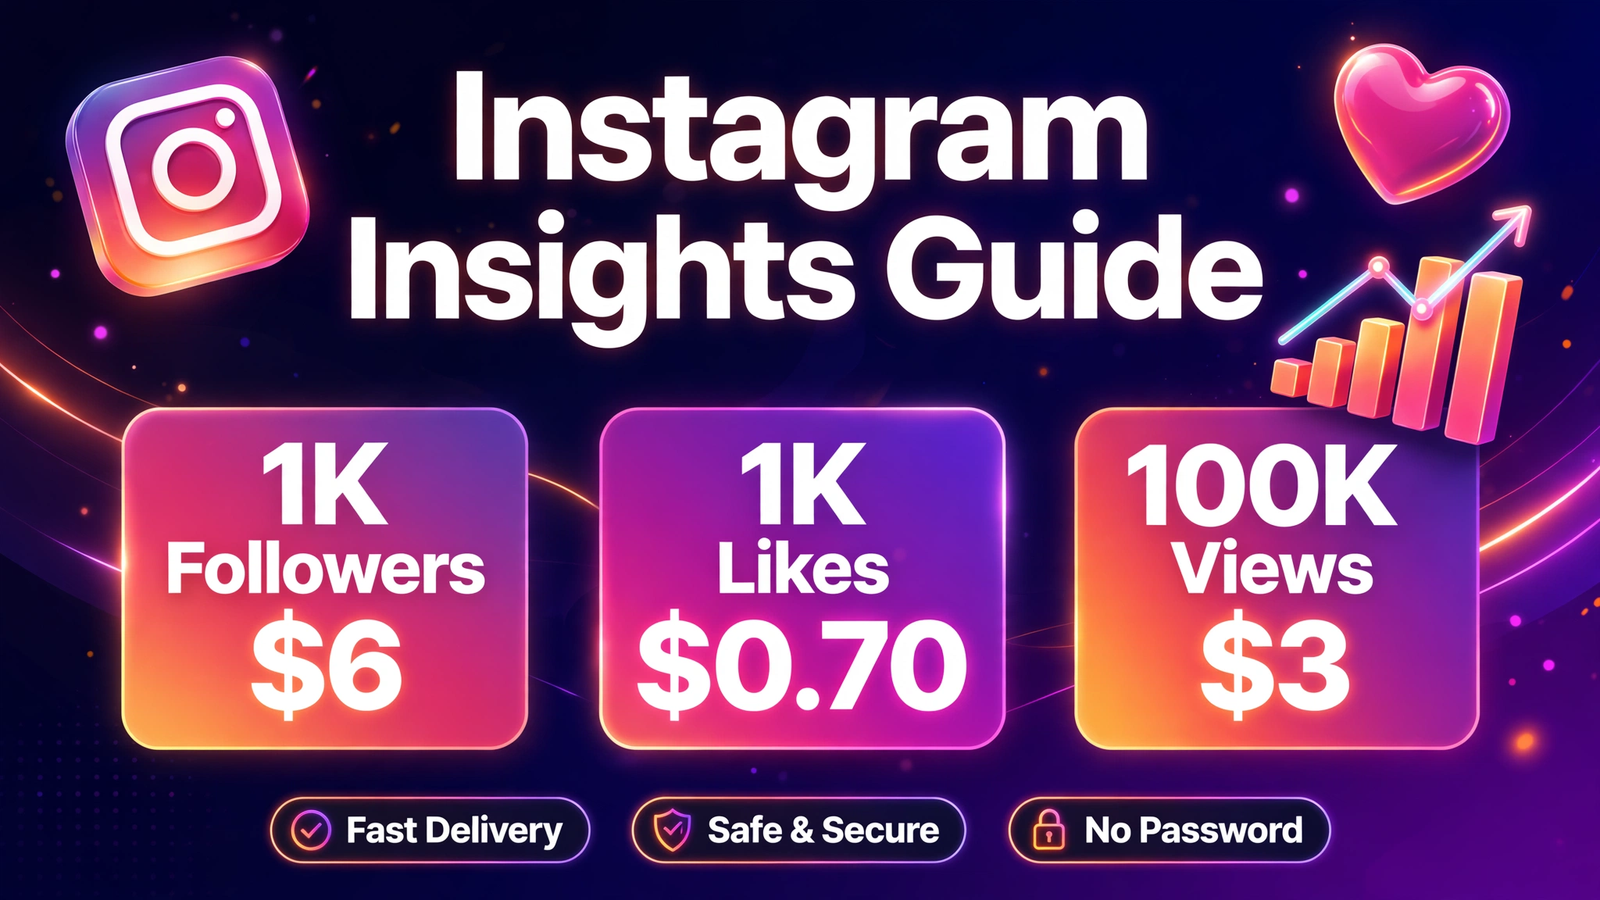
One honest word for accounts starting near zero: a dashboard full of single-digit numbers is discouraging and, worse, unreadable — there is no signal in noise. If you want your first months of analytics to measure real behaviour instead of rounding errors, starting from a credible base helps: 1,000 Instagram followers costs $6 from our Instagram followers service, and from that point every Insights metric starts meaning something. Or message us on WhatsApp and we will point you at the right starter package.
Instagram Professional Dashboard Guide: What's Inside the Hub
The instagram professional dashboard guide begins where your profile does: the Professional dashboard is the command centre that sits under your bio, and it opens onto the three views you will use most — account overview, content you shared, and audience. Everything else branches off these.
Accounts reached is the headline of the account overview: the total unique accounts that saw anything you posted in the selected period, with a follower/non-follower split. That split is worth more than the total — a high non-follower share means the algorithm is pushing you outward, while a follower-only number means you are preaching to the choir. Accounts engaged narrows that to people who did something — liked, commented, saved, shared, replied, tapped. The gap between reached and engaged is your content's conversion problem stated as a number.
Total followers is where the audience section lives: growth over the period, follows versus unfollows, demographics (top cities and countries, age ranges, gender), and the Most active times chart we will use later to find your posting windows.
Content you shared is the workhorse: every post, Story and Reel, sortable by any metric. This is where strategic reading actually happens — not in the account overview, which flatters or depresses indiscriminately, but post by post. And one navigation note: on desktop, open Meta Business Suite instead. The desktop view gives wider date ranges, content-type filtering, and a spreadsheet export option the mobile app does not have. Treat mobile Insights as the daily check and desktop as the monthly review surface.
What Do Instagram Insights Mean? The Core Metrics, Translated
What do Instagram Insights mean in plain language? Each metric answers one plain question. Reach answers "how many people saw it?", views answers "how many times was it played?", engagement answers "how many acted on it?", and follows answers "how many joined because of it?" — those four, in that order, are the hierarchy worth memorising.
Before the glossary, the translation every old tutorial gets wrong: Views is the headline metric since the 2024–2025 migration, and "impressions" is deprecated on newer content. Do not compare a 2024 impressions number with a 2026 views number on the same chart — they are different measurements. Views will always be equal to or higher than reach, because reach counts people and views counts events.
| Metric | What it measures | How to read it |
|---|---|---|
| Reach | Unique accounts that saw your content | The visibility number — your content's true distribution |
| Views | Total plays/displays, replays included | Compare against reach: views ÷ reach is your rewatch ratio |
| Interactions | Likes, comments, saves, shares combined | The raw material for your engagement-rate calculation |
| Saves | Users who bookmarked your post | Strongest value signal — saved posts travel furthest over time |
| Shares / sends | DMs and Story re-shares | The top algorithmic signal in 2026, per Instagram's creator team |
| Follows | New followers attributed to that content | The growth metric — optimise for this, not likes |
| Profile visits | Accounts that opened your profile from the content | Curiosity signal — high visits with low follows means your profile needs work |
| Watch time | Average seconds viewers spent on a video | Critical for Reels — short watch time is a hook problem |
| Story exits | Viewers who left Stories entirely | Worse than forward taps — exits mean full disengagement |
The single most useful derived number in this whole table is the rewatch ratio: views divided by reach. A Reel with 40,000 views against 10,000 reach was watched four times per person on average — genuinely strong content. A Reel with 11,000 views against 10,000 reach was seen once and scrolled past. Same reach, very different stories. Instagram gives you both numbers, so calculate the ratio yourself.
One metric to be careful with: interactions can actually go down, because Instagram subtracts unlikes, unsaves and deleted comments. If a number dips overnight, check for that before assuming the content failed. And a rule of thumb for priorities: saves and shares beat likes for distribution, follows beat everything for growth. A post with 200 likes and 40 new followers outperformed a post with 2,000 likes and 2 followers — Insights tells you which was which, so judge accordingly.
Instagram Audience Insights Explained: Who Follows You and When They're Online
Instagram audience Insights explained is the demographic half of the dashboard: top cities and countries, age ranges, gender split, follower growth, and the Most active times chart. This is the panel that answers "who am I actually making content for?" — and the answer sometimes disagrees with your assumptions.
Start with top locations. If you are a UK-focused account and 60% of your followers are in a different country, everything about your posting schedule — and possibly your language, references, and product links — is calibrated to the wrong timezone. Location is the first thing to fix before you touch timing. Then check the age and gender breakdowns against the audience you had in mind: a fashion account whose audience skews 45+ is playing a different game than one that skews 18–24, and pretending otherwise is how content calendars go stale.
Follower growth, split into follows and unfollows, is the trend line that matters most over months. A slow net gain with high churn (many follows, many unfollows) tells a different story than slow growth with low churn: the first means your content attracts but your profile fails to retain — a bio, grid, and pinned-posts problem. The second means your content simply is not travelling — a reach problem. Insights will not diagnose this for you, but the two patterns point at two different fixes, and knowing which one you have saves months of guessing.
The chart most people screenshot and few people use properly is Most active times: an hourly grid showing when your specific followers are online, plus a days view for the weekly pattern. That chart is the raw material for the next section — how to turn it into actual posting times rather than a screenshot you look at once.
How to Find Best Posting Time in Insights
Knowing how to find best posting time in Insights is worth more than every generic "best times to post" chart online, because your followers' habits are yours alone — a B2B coach's audience scrolls at lunch, a DJ's audience wakes up on Friday night. Generic averages blend thousands of unrelated accounts; your dashboard does not.
Step 1: Open Insights, tap Total followers, and scroll to Most active times.
Step 2: Read the Hours view first — it shows activity across a single day. Find the darkest bars: those are your peak hours.
Step 3: Switch to the Days view. Weekends almost always look different from weekdays; read them as two separate audiences.
Step 4: Note the peak, then post about an hour before it, not during it. A post published at the peak starts cold just as the wave crests; a post published an hour earlier has early engagement stacked up and rides the surge.
Step 5: Hold the schedule for two to three weeks, then check whether the posts actually reached further. The active-times chart predicts the crowd; the results confirm it. If the flat-line case appears — roughly even activity all day — that is a real answer too: it means your audience spans time zones, timing barely matters, and your effort is better spent on the content itself.
Once you have your windows, they belong inside a repeatable plan rather than living as a mental note. Our Instagram content calendar 2026 guide shows how to build the weekly schedule around them — which formats go in which slots, and how to keep the cadence sustainable. And if you are unsure whether timing or the content itself is the bottleneck, test it: one variable at a time is the only experiment that teaches anything.
How to Use Instagram Insights 2026 for Reels, Stories, and Posts
How to use Instagram Insights 2026 properly means reading each format on its own terms, because each one has a different job. The account overview blends them together; the Content you shared panel, filtered by format, is where the real learning happens.
For Reels, open any Reel and tap View insights beneath the caption. Read three numbers: views and replays (replays are your retention signal), average watch percentage, and follows from the Reel. The pattern worth hunting is high views with low follows — the content entertains but does not build loyalty. That combination usually means you need a stronger reason to follow: more opinion, more teaching, more series. Reels with modest views but strong follows-per-view are your actual growth engine; make more of those, even if the big-view Reels feel better.
For Stories, swipe up on an active Story for frame-by-frame data, or find archived Stories under Content you shared. The pair that matters is forward taps versus exits: a forward tap is a skip (your frame did not hold attention), an exit is an abandonment (the whole sequence lost them). A spike of exits on frame three tells you exactly where your sequence breaks — move the hook or the call to action earlier. And a practical warning: Story data ages fast, so check Stories within a day or two, not at month end.
For posts and carousels, the metrics that matter are saves, shares, and profile visits — in that order. A post that saves well but converts no profile visits needs a stronger call to action; a carousel with saves concentrated on slide one tells you the later slides never got seen. Compare formats honestly: if carousels consistently earn more saves per reach than single images, the algorithm has told you what it prefers — listen.
And one pattern worth reading honestly: if your Reels consistently show thin view counts, the problem may be social proof, not content. A Reel with 300 views gets scrolled past; the same Reel with 100,000 views gets watched. Our Instagram views packages start at 100,000 views for $3 — a cheap way to give strong content the credibility it needs to be judged fairly. For shares specifically, the strategy side is covered in our buy Instagram shares guide.
How to Track Instagram Growth Analytics: Your Own Baseline, No Fake Benchmarks
How to track Instagram growth analytics correctly starts with ignoring the benchmark charts. Instagram publishes no official engagement-rate benchmarks — any "3% is good, 6% is excellent" figure you have seen was invented by somebody, and third-party studies disagree with each other by multiples. The only benchmark that means anything is your own.
Build it in one sitting: export or copy your last 20–30 posts' interactions (likes + comments + saves + shares) and reach, compute engagement rate = interactions ÷ reach × 100 for each, and take the median. Use reach in the denominator, not followers — reach answers "of the people who actually saw this, how many did something?", which is the question that matters. Follower-based rates distort the moment a post travels beyond your followers, and view-based rates flatter rewatch-heavy content.
With that baseline in hand, tracking growth analytics becomes a weekly comparison, not a guessing game. Each new post gets a simple verdict: above baseline (make more of this), at baseline (steady), below baseline (diagnose — was it the hook, the topic, the timing, or the format?). Keep the spreadsheet simple: date, format, reach, saves, shares, follows, engagement rate, one-line verdict. Five minutes per post, and after two months you will have a dataset no generic benchmark could ever give you.
One extra ratio worth trending alongside: sends per reach — shares divided by reach. Instagram's head Adam Mosseri has repeatedly pointed to sends, watch time and likes as the distribution signals, with sends carrying the most weight for reaching non-followers. Instagram does not display it as a field, so calculate it yourself and watch the trend. If it climbs, your content is becoming more recommendable; if it slides, you are becoming background noise.
What Instagram Insights Won't Tell You
What Instagram Insights won't tell you matters as much as what it will, because most frustration with the dashboard comes from expecting things it was never built to do. Set the expectations once and the numbers get much more useful.
Who specifically viewed your profile or a post. Insights is aggregate only: it shows how many accounts visited, never which. Stories and live broadcasts are the exceptions, where you do see a viewer list. Anyone selling you a tool that names your profile visitors is not being honest.
Competitor data. Nothing about other accounts beyond what is public on their profiles — their post counts, visible likes, and follower numbers. There is no benchmarking tab, and the Instagram Help Center documentation describes Insights strictly as first-party analytics.
Long-run history. This is the costly one: account-level data goes back about 90 days, and the window rolls — each new day permanently pushes the oldest day out, with no archive behind it. The fix is a monthly habit: on desktop, Meta Business Suite → Insights has a spreadsheet export. Five minutes a month gives you the year-over-year view Instagram will not. Per Meta's own developer documentation, user metric data is stored for up to 90 days — plan around that, not around it.
Real-time numbers. Insights lags, often by hours. Judging a post in its first thirty minutes is reading noise — the early-view counts are not final, and the demographic breakdowns fill in later. Check the next day for the real story.
From Numbers to Action: a 15-Minute Weekly Insights Routine
Data that does not change a decision is decoration. The point of learning how to use Instagram Insights 2026 is a weekly loop: read, decide, adjust. Fifteen minutes, same slot every week, and the dashboard becomes the engine of your content calendar rather than a curiosity you check after a viral post.
Step 1 — Check the trend (2 minutes). Open the account overview and compare accounts reached, accounts engaged and total followers against the previous period. Direction matters more than absolutes: is the line going the right way?
Step 2 — Grade your posts (5 minutes). In Content you shared, sort by your key metric for the week — saves for value content, shares for viral content, follows for growth content. Put each post above or below your personal baseline. Note the single biggest winner and ask what it did differently: topic, format, hook, timing.
Step 3 — Check the audience (3 minutes). Glance at follower growth and the top locations. If the demographics drifted, adjust the next week's topics back toward your intended audience before the drift compounds.
Step 4 — Set one experiment (5 minutes). Convert the week's lesson into exactly one change: post at the new time, try the winning format again with a different topic, or cut the format that underperformed twice in a row. One variable per week is the rule — changing five things teaches you nothing about which one worked.
And if the weekly grades keep saying the same thing — solid content, weak distribution — remember the ratio problem. Views that look thin make everything else harder: fewer profile visits, fewer follows, worse ratios everywhere. Pairing your best-performing format with a credibility base is not cheating the data; it is giving the data a fair test. 1,000 likes costs $0.70 from our Instagram likes packages — enough to keep a boosted post's engagement believable — and WhatsApp us if you want help matching packages to what your Insights are actually telling you.
Frequently Asked Questions About Instagram Insights
Yes. Instagram Insights is only available on professional accounts — Business or Creator. Personal and private accounts see basic likes and comments only, with no reach data, audience demographics or active times. Switching is free in Settings, takes about a minute, and does not change how your profile looks to anyone.
The usual cause is a personal account type: switch to a professional account in Settings and privacy, under Account type and tools. Two more reasons are common: Instagram does not backfill data, so there is nothing to show until you post after switching; and very small accounts see a thinner dashboard until their audience grows.
Reach counts unique accounts that saw your content — people. Views counts every play or display, replays included. One person watching a Reel three times adds 1 to reach and 3 to views. Dividing views by reach gives a rewatch ratio: a high ratio means people watched more than once, which is a strong quality signal.
Open Insights, go to Total followers and scroll to Most active times. The Hours view shows activity across a single day and the Days view shows which weekdays are strongest. Post one hour before the peak — not during it — so it catches the surge. Check weekdays and weekends separately, because the patterns usually differ.
Account-level data is kept for about 90 days, and the window rolls: each new day permanently pushes the oldest day out, and there is no archive to go back to. Individual posts keep their own lifetime counters. For any year-over-year view, export your numbers monthly from Meta Business Suite on desktop, which has a spreadsheet export option.
No. Insights is aggregate only: it shows how many accounts visited your profile, not which accounts they were. The exceptions are Stories and live broadcasts, where Instagram does show a viewer list. If you want profile-visitor identities, no analytics tool can provide them — anyone claiming otherwise is not being honest.